The ROAS Playbook: How to Calculate, Benchmark, and Improve It
An operator-grade walkthrough of ROAS — formula, breakeven framework, vertical benchmarks, attribution caveats, and five tactics that actually move the number.
ROAS is the metric everyone quotes and almost no one defines the same way. Finance wants gross-margin ROAS. The media buyer wants platform-reported ROAS. The board wants blended ROAS. Three different numbers, one acronym. This is the operator’s reference: the formula, a breakeven framework, benchmark tables by vertical, the five tactics that actually move the number, and the attribution caveats that decide whether your ROAS is real or a story your ad platform tells you.
TL;DR
- ROAS = Revenue from ads ÷ Ad spend. Simple. The fight is over which “revenue” and which “spend” you use.
- Breakeven ROAS = 1 ÷ Contribution margin. A 30% margin product breaks even at 3.33x. Below that you lose money on every sale.
- Benchmarks vary 5x by vertical. A 4x ROAS is excellent for apparel, mediocre for jewellery, terrible for mobile gaming installs (which use CPI instead).
- The fastest ROAS gains come from creative, not bid strategy. Triple your tested hooks per week before you touch the bid cap.
- Platform ROAS lies by 20-60% on iOS and in privacy-restricted geos. Use platform numbers for in-platform optimization, blended ROAS for budget allocation.
What is ROAS
Return on Ad Spend is revenue divided by spend, expressed as a multiple. Spend $1,000 on Meta, attribute $4,000 in revenue back to those ads, ROAS is 4x (or 400%). The acronym is universal across paid social, paid search, retail media, and programmatic.
The reason ROAS is the default operator metric and not, say, profit per dollar is speed. ROAS reports in hours. Gross profit reports in days. Net profit reports in weeks after returns and shipping and finance closes the month. If you are bidding on Meta Advantage+ at 2pm, you need a number that moves in time for the 6pm bid decision.
That speed is also why ROAS gets misused. The number is easy to game.
The ROAS formula (with worked examples)
The base formula:
ROAS = Attributed Revenue / Ad SpendWorked example — a DTC supplement brand running Meta:
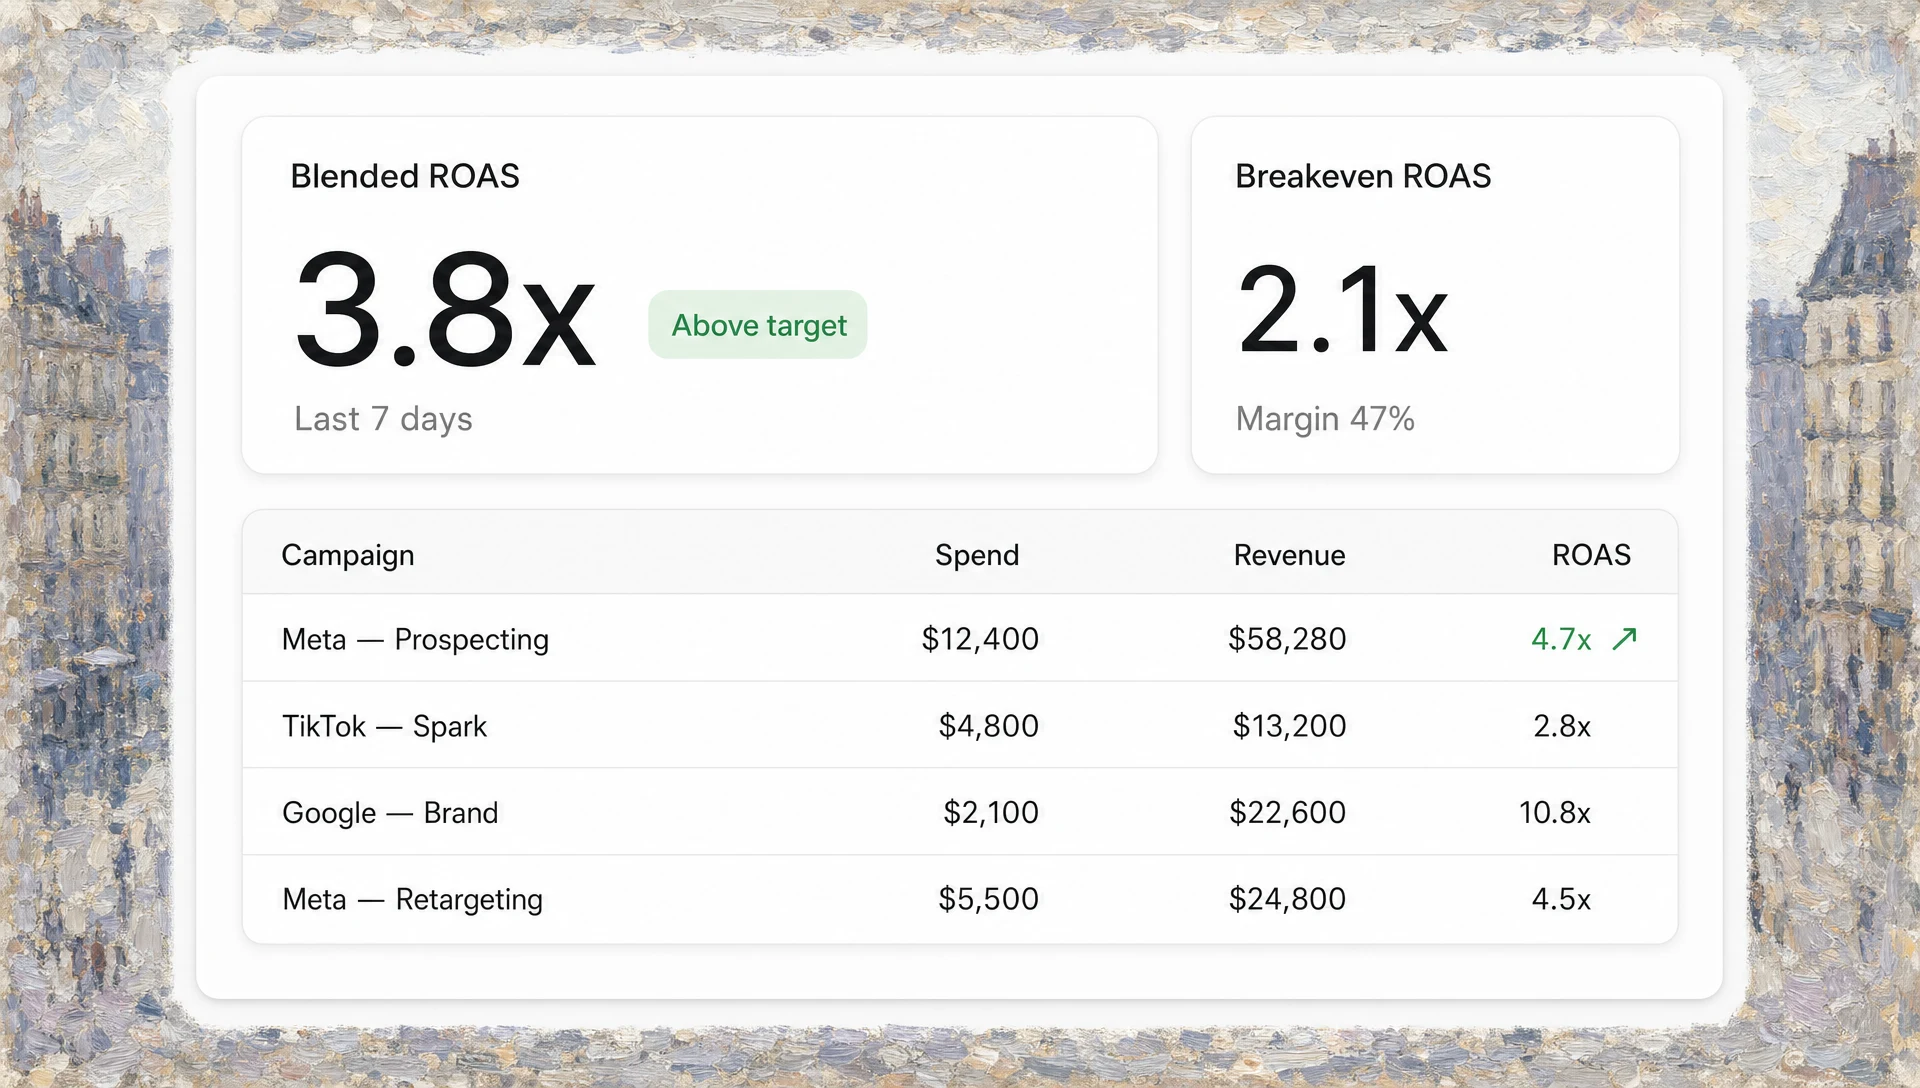
- Ad spend (Meta, last 7 days): $12,400
- Attributed revenue (Meta-reported, 7-day click + 1-day view): $58,280
- ROAS = 58,280 / 12,400 = 4.7x
Same brand, same period, different lens:
- Blended revenue (Shopify total, last 7 days): $94,200
- Total marketing spend (Meta + Google + TikTok + affiliate): $24,800
- Blended ROAS = 94,200 / 24,800 = 3.8x
Two valid ROAS numbers, neither wrong, neither directly comparable. The Meta number tells you whether Meta’s algorithm is finding profitable conversions. The blended number tells you whether the business is profitable. Use both, never confuse them.
Try it: a quick ROAS calculator
The calculator below runs locally in your browser. No data leaves the page.
Breakeven ROAS: the only ROAS number that matters first
Before you set a target ROAS, calculate your breakeven. The formula:
Breakeven ROAS = 1 / Contribution MarginContribution margin is the percentage of revenue left after variable costs (COGS, payment processing, shipping, fulfilment). It is not gross margin and it is not net margin. It is the slice that pays for ad spend before fixed costs hit.
Worked examples:
| Vertical | Typical contribution margin | Breakeven ROAS |
|---|---|---|
| DTC supplements | 60% | 1.67x |
| DTC apparel | 45% | 2.22x |
| DTC consumer electronics | 25% | 4.00x |
| Subscription SaaS (LTV-based) | 75% on first 12 months | 1.33x on LTV |
| Marketplace / aggregator | 12% (commission) | 8.33x on GMV |
| Mobile game (IAP) | 30% (after platform fee) | 3.33x on D30 revenue |
Two implications most operators miss:
- A “good” ROAS is brand-specific. A 3x ROAS is profitable for a 60% margin supplement brand and catastrophic for a 25% margin electronics brand.
- Hitting breakeven is not winning. You need ROAS comfortably above breakeven to cover fixed costs (salaries, rent, software) and generate cash for growth. Most DTC brands set a target ROAS at roughly 1.5x their breakeven.
ROI vs ROAS: not the same metric
ROI and ROAS are confused constantly because they sound similar and use similar formulas. They are not interchangeable.
ROAS = Revenue from ads / Ad spend. Top-line metric. Tells you how efficiently ads turn spend into revenue.
ROI = (Profit from ads − Ad spend) / Ad spend, expressed as a percentage. Bottom-line metric. Tells you how much profit each dollar of ad spend returned.
Worked example, same campaign:
- Ad spend: $10,000
- Revenue from ads: $40,000
- COGS, shipping, fees on that revenue (assuming 32% contribution margin): revenue × (1 − 0.32) = $27,200
- Gross profit on that revenue: $40,000 − $27,200 = $12,800
- Profit after ad spend: $12,800 − $10,000 = $2,800
ROAS = $40,000 / $10,000 = 4x ROI = $2,800 / $10,000 = 28%
Both numbers are correct. ROAS at 4x sounds excellent. ROI at 28% is solid but not spectacular. The disconnect is exactly the breakeven point above. A campaign with 4x ROAS on a 25% margin product would have a negative ROI.
Use ROAS for in-campaign optimization (faster, easier to compute). Use ROI when reporting to finance or making budget allocation calls.
Benchmarks by vertical (use these as a starting point, not gospel)
These numbers come from a mix of public WordStream benchmarks (paid search), Triple Whale DTC benchmarks, and platform-published averages. Treat them as a starting reference. Your category mix, AOV, and creative quality will move you 30-50% in either direction.
Meta Ads (DTC ecommerce, blended)
| Vertical | Median ROAS | Top quartile |
|---|---|---|
| Apparel & accessories | 2.8x | 4.5x+ |
| Beauty & personal care | 3.2x | 5.0x+ |
| Supplements & nutrition | 3.6x | 6.0x+ |
| Home & garden | 2.4x | 3.8x+ |
| Consumer electronics | 2.1x | 3.4x+ |
| Jewelry | 4.5x | 7.0x+ |
Google Ads (search, brand + non-brand blended)
| Vertical | Median ROAS |
|---|---|
| Ecommerce — high consideration | 4.2x |
| Ecommerce — low consideration | 6.0x+ |
| SaaS / lead gen | 3.5x (on first-year contract value) |
| Local services | 5.0x+ |
Mobile apps
Mobile apps mostly do not measure ROAS on day one. The metric is CPI (cost per install) compared against LTV. Operator-grade benchmarks for that live in our 2026 CPI benchmarks for mobile apps piece, which uses AppsFlyer and Adjust data.
When you do measure ROAS for mobile, use D7 ROAS or D30 ROAS (revenue captured 7 or 30 days post-install). Day-1 ROAS is essentially useless for everything except hyper-casual games.
B2B SaaS
ROAS for B2B SaaS is a bad metric unless you compute it on LTV, not first-month MRR. The honest version:
LTV-based ROAS = (Average contract value × Gross margin) / CACFor most subscription products that lands somewhere between 3x and 5x as a healthy target on first-year LTV, scaling to 10x+ across the lifetime of the customer.
How to improve ROAS (five tactics that actually work)
In order of impact, with the caveat that #1 is almost always the right answer.
1. Test more creative, faster
Creative explains the majority of paid-social performance variance in 2026. The exact share varies by platform and study, but the direction is clear: targeting and bid strategy have been largely automated by Meta Advantage+ and TikTok Smart+, leaving creative as the operator-controlled lever.
The operator metric to watch here is tested creative concepts per week per brand. Most underperforming brands run 2-5 concepts a week. High-performers run 15-30+. The gap is workflow, not headcount. Tools like Motion, Foreplay (for ad swipe research), and AI generators like Superscale have collapsed creative production time enough that the bottleneck moved from “can we make 10 ads” to “can we brief and review 10 ads.”
A real performance lift to anchor on: Superscale’s Taxfix case study reported +45% CTR on a street-interview format that the brand then scaled across 80% of its creatives. The lift came from testing the new format, not from rebidding the old one.
2. Fix your breakeven first (raise margin, not ROAS)
Many operators try to bid harder when the real problem is margin. A 5% margin improvement on a 30% margin product drops your breakeven ROAS from 3.33x to 2.86x — a 14% breakeven improvement from a 5% margin move. Easiest source: shipping fees, return policy, and packaging cost. Less easy but bigger: SKU mix and AOV. A bundle with 5 percentage points higher margin lets every ad work harder.
3. Tighten the post-click funnel
LP CVR is the multiplier on every ROAS number. Going from 2% to 3% CVR is a 50% ROAS lift with no change in spend or creative. The diagnostic checklist:
- Above-fold message matches the ad creative within 2 seconds.
- One CTA, repeated at every scroll depth.
- Mobile load under 2.5 seconds on a 4G connection.
- Trust signals (reviews, press, returns policy) within the first scroll.
- Checkout: guest checkout enabled, payment methods include Apple Pay and Shop Pay.
Brands with great CRO discipline run ROAS 30-50% above category median on identical creative.
4. Use bid strategy to defend, not to drive
Manual bid caps and tROAS targets are defensive tools. They protect against the algorithm finding cheap-but-bad conversions. They do not create efficiency that wasn’t already in the creative or the offer. The default in 2026 should be Advantage+ Shopping on Meta with a tROAS guardrail set 10-15% above breakeven, TikTok Smart+ on TikTok, and Maximize Conversions with tROAS on Google Ads Performance Max. Hand-set bid caps are reserved for catalog ads in specific SKU tiers and for retention campaigns where you actively want to suppress volume.
5. Move budget toward winners faster
Most brands take too long to kill losers and too long to scale winners. A practical cadence:
- Day 1-3: hold spend flat. The algorithm needs the learning phase.
- Day 4-7: kill anything below 50% of breakeven ROAS. Hold flat on anything in the breakeven-to-target range.
- Day 8+: scale winners (above 1.3x target) by 20% every 2-3 days. Faster scaling spikes CPMs and tanks ROAS.
The point of this cadence is not the exact percentages. It is to have a written rule that prevents you from babysitting underperformers and being slow to back winners.
Attribution caveats: the part that breaks ROAS
The biggest single mistake operators make with ROAS is treating platform-reported ROAS as truth. It almost never is.
The iOS 14.5 effect. ATT removed deterministic attribution for the majority of iOS Meta traffic. Meta now backfills with modeled conversions (statistical estimates). Modeled conversions inflate platform-reported ROAS by roughly 20-40% in our experience, sometimes more for iOS-heavy brands.
The view-through window. Meta’s default attribution is 7-day click + 1-day view. The 1-day view setting double-counts revenue that would have happened organically. The conservative setting (7-day click only) typically drops reported ROAS by 15-25% but reflects incremental performance more honestly.
Cross-channel double-counting. Meta, Google, TikTok, and your affiliate platform all claim the same conversion. Add up platform ROAS and you frequently get more revenue than your Shopify store actually did.
The fix isn’t perfect, but it has a shape.
- Use platform ROAS for in-platform optimization (within Meta, optimize for Meta’s ROAS).
- Use blended ROAS for budget allocation across channels (Shopify revenue / total marketing spend).
- Use an MMM or incrementality tool to estimate true incremental contribution. Triple Whale and Northbeam are the two operator-grade DTC choices. For mobile, AppsFlyer and Adjust ship MMP attribution that beats platform numbers significantly.
- Run geo holdout tests quarterly to validate that the lift you see in platform ROAS is real.
For a deeper unpack of the underlying models, our marketing attribution models explainer walks through first-touch, last-touch, linear, time-decay, position-based, and data-driven attribution with worked examples.
ROAS on Google Ads specifically
Google ROAS has its own oddities worth flagging.
- Shopping campaigns and Performance Max ship with target ROAS bidding (tROAS) as the default. Set tROAS conservatively at launch (10-20% below your target) and let the algorithm find efficiency, then tighten weekly.
- Brand search inflates blended Google ROAS substantially. Split it into a separate campaign and exclude from non-brand performance reporting.
- Search lost IS (budget) under 20% is healthy; above 30% means you’re under-funding a working campaign.
- Conversion attribution model. Google moved to data-driven attribution by default in 2023. It generally reports higher ROAS than the older last-click model. If you switched recently, your “ROAS lift” is partly model change, not real improvement.
What we’d do
If you are an operator inheriting a paid program with messy ROAS:
- Week 1: calculate true breakeven ROAS for each top 5 SKU. Set channel-level target ROAS at 1.3-1.5x breakeven.
- Week 2: install a blended attribution tool (Triple Whale, Northbeam, or even a manual Shopify + GA4 dashboard). Stop quoting platform ROAS in board-level reporting.
- Week 3-4: audit your creative testing cadence. If you’re under 10 concepts per week, fix that before touching bids. Our AI ad workflow playbook covers the production side.
- Quarterly: run a geo holdout to validate platform-reported lift. The first one will be uncomfortable.
The ROAS number you want is the one your finance team can reconcile to bank deposits. Anything else is a story.
FAQ
What is a good ROAS?
It depends entirely on contribution margin. A 60% margin brand can run at 2x and be profitable. A 25% margin brand needs 4x+ to break even. Calculate your breakeven first (1 / contribution margin), then target 1.3-1.5x breakeven as a healthy operating range.
How is ROAS different from ROI?
ROAS measures revenue per dollar of ad spend (a top-line ratio). ROI measures profit per dollar of ad spend (a bottom-line percentage). A 4x ROAS sounds great but can produce a negative ROI on a low-margin product. ROAS is faster and easier to report; ROI is the metric finance actually cares about.
How do you calculate breakeven ROAS?
Breakeven ROAS = 1 / contribution margin. Contribution margin is the percentage of revenue left after variable costs (COGS, shipping, payment processing). A 32% margin product has a breakeven ROAS of 1 / 0.32 = 3.13x. Below that, you lose money on every incremental sale.
Why is my Meta ROAS higher than my Shopify revenue suggests?
Three usual suspects: iOS modeled conversions inflating reported numbers, the 1-day view-through window double-counting organic revenue, and cross-channel double-counting where Meta and Google both claim the same conversion. Switch Meta to 7-day click only, compare against blended Shopify-divided-by-total-spend ROAS, and use an MMM tool to validate.
How do I increase ROAS quickly?
In order of impact: (1) test more creative concepts per week, (2) improve your landing page conversion rate, (3) audit your offer and AOV, (4) tighten bid strategy as a defense. Most operators reach for #4 first because it’s the fastest to execute. It’s also the smallest lever in 2026 since the platforms have automated most of the bidding decision.
Related reading
- How to launch AI ads on Meta — the launch checklist for the Meta side.
- Marketing attribution models explained — the deeper attribution unpack.
- 2026 CPI benchmarks for mobile apps — the mobile-app equivalent of the benchmarks above.
- The agency AI ad workflow playbook — the production cadence that supports a 15+ concepts-per-week creative test rate.
- SEO vs AEO in 2026 — the upper-funnel equivalent metrics.
- Superscale review — the AI ad agent we cited for the Taxfix +45% CTR creative lift.
- The best AI ad creative tools of 2026 — the broader tool field guide.
Letters from readers
-
Q·01 How is ad-stack funded?
We pay for every tool seat ourselves at the public plan tier, and the journal is reader-supported via the newsletter. No vendor pays for placement, and no review is sponsored.
-
Q·02 Why benchmark on the same brief instead of letting each tool play to its strengths?
Because the only fair variable in a head-to-head test is the tool. Letting each vendor pick their best demo brief is how the AI ad category got into its current marketing-led mess — every tool wins on its own showcase. Same brief means you can actually compare cost-to-published across the field.
-
Q·03 How often do you re-test tools that have shipped major updates?
Every quarter. Reviews carry a 'last tested' date in the byline. If a tool ships a meaningful capability change between quarterly cycles, we publish a field note rather than waiting — but the score on the main review only moves at the next full re-test.
-
Q·04 Can I send in a tool to be reviewed?
Yes — send a note via the contact link in the footer. We can't promise coverage of every submission, and being suggested has no bearing on the eventual verdict. Vendors who pay for seats themselves rather than offering us free credits are evaluated identically.