Marketing Attribution Models Explained (and Which to Use When)
First-touch, last-touch, linear, time-decay, position-based, and data-driven attribution. Worked examples and a modern stack recommendation.
Attribution is the question of which touchpoint deserves credit for a conversion. Asked once, easy. Asked a million times across a noisy customer journey with iOS privacy restrictions and walled-garden reporting, it becomes the messiest measurement problem in marketing. This is the operator’s reference to the six attribution models that actually get used in 2026, how each one credits revenue, when each works, and what the modern stack looks like.
TL;DR
- There is no perfect attribution model. Every model is wrong in a different way. The job is picking the model whose wrongness matches your decision context.
- Single-touch models (first-touch, last-touch) are useful as floors and ceilings, not for budget allocation.
- Multi-touch models (linear, time-decay, position-based) distribute credit across the journey but assume credit is conserved, which it isn’t.
- Data-driven / Markov-chain attribution is the operator default for sophisticated programs. Still imperfect, still requires sanity checks.
- The modern stack is MMM (marketing mix modeling) for top-down budget allocation + incrementality testing for validation + MMP for mobile + multi-touch attribution as a tactical optimization layer.
Why attribution matters (and why it’s hard)
Every dollar of marketing spend competes with every other dollar. Without attribution, you can’t tell whether the $50K you spent on Meta last month produced more revenue than the $20K you spent on TikTok. Without that, budget allocation is guesswork.
The hard part: customers don’t convert linearly. A buyer might see a TikTok ad on Tuesday, search the brand on Google Wednesday, click a retargeting Meta ad Thursday, get a newsletter Friday, and finally convert Saturday from a direct visit. Which of those touchpoints “caused” the conversion? Five models will give you five different answers, all defensible, none provably true.
Add iOS 14.5, the cookie deprecation creep, the walled-garden algorithms that backfill missing data with their own estimates, and the fact that the platforms each claim 100% of the credit when asked individually — and you’re left with attribution as a discipline of useful approximations rather than truth.
The six attribution models
1. First-touch (first-click) attribution
How it credits: 100% of the credit goes to the first touchpoint in the journey.
Worked example: Customer sees a TikTok ad → searches Google → clicks Meta retargeting → converts. First-touch credits TikTok with 100% of revenue.
When to use it: brand-awareness measurement, top-of-funnel budget justification, content marketing ROI. The model answers “what introduced this customer to us?”
When it fails: budget allocation. First-touch over-credits awareness channels and under-credits the channels that close conversions. Run a business on pure first-touch attribution and you’ll over-spend on TikTok awareness and underfund Google retargeting.
2. Last-touch (last-click) attribution
How it credits: 100% of the credit goes to the last touchpoint before conversion.
Worked example: Same journey. Last-touch credits Meta retargeting with 100% of revenue. The TikTok awareness touch and the Google research touch both get zero.
When to use it: the default mode for most ad platforms and Google Analytics historically. Useful as a conservative floor — “this is the minimum credit this channel deserves.” Cheap to compute, easy to explain.
When it fails: any high-consideration product with a meaningful research journey. Last-touch over-credits retargeting and branded search, under-credits awareness, and creates a feedback loop where you scale the channels that close (because they look efficient) while starving the channels that fill the funnel (because they look inefficient).
This is the single most common attribution error in operator-led brands. Last-touch looks honest because it’s deterministic. It’s also systematically biased.
3. Linear attribution
How it credits: equal credit to every touchpoint in the journey.
Worked example: Four touchpoints (TikTok, Google, Meta, direct). Linear credits each with 25%.
When to use it: when you have no opinion about which touchpoints matter more than others, and you want a simple baseline that beats single-touch. Linear is a useful sanity check against last-touch — if last-touch says Meta drove 80% of revenue and linear says Meta drove 30%, the truth is somewhere in between.
When it fails: it assumes every touchpoint is equally important, which is almost never true. A throwaway display impression and a high-intent search click don’t deserve the same credit, but linear gives them the same credit.
4. Time-decay attribution
How it credits: more credit to touchpoints closer to conversion, less to earlier ones. The decay is typically exponential with a half-life of around 7 days.
Worked example: Same four-touch journey across 5 days. Time-decay might credit TikTok (day 1) with 10%, Google (day 3) with 20%, Meta (day 4) with 30%, direct (day 5) with 40%.
When to use it: high-velocity purchase categories (DTC consumables, fashion, low-AOV ecom) where the buying window is short and the last few touches really do matter most.
When it fails: long-consideration categories (B2B SaaS, big-ticket DTC, mobile apps with multi-week activation). Time-decay punishes awareness channels in long journeys even when those channels were the entire reason the customer started looking.
5. Position-based attribution (U-shaped, W-shaped)
How it credits: more credit to the first and last touchpoints, less to the middle. The standard U-shape gives 40% to first, 40% to last, 20% split across the middle touches. W-shape adds a third spike at a “lead created” or “trial started” milestone.
Worked example: Same four-touch journey. U-shape credits TikTok 40%, Google 10%, Meta 10%, direct 40%.
When to use it: longer consideration journeys where you want to acknowledge both the introduction touch and the closing touch as load-bearing. Often the model finance teams find most intuitive — “what brought them in and what closed them.”
When it fails: it’s a heuristic. The 40/20/40 split isn’t derived from your data; it’s just a rule. If your actual journey looks nothing like that pattern, position-based will mis-credit systematically.
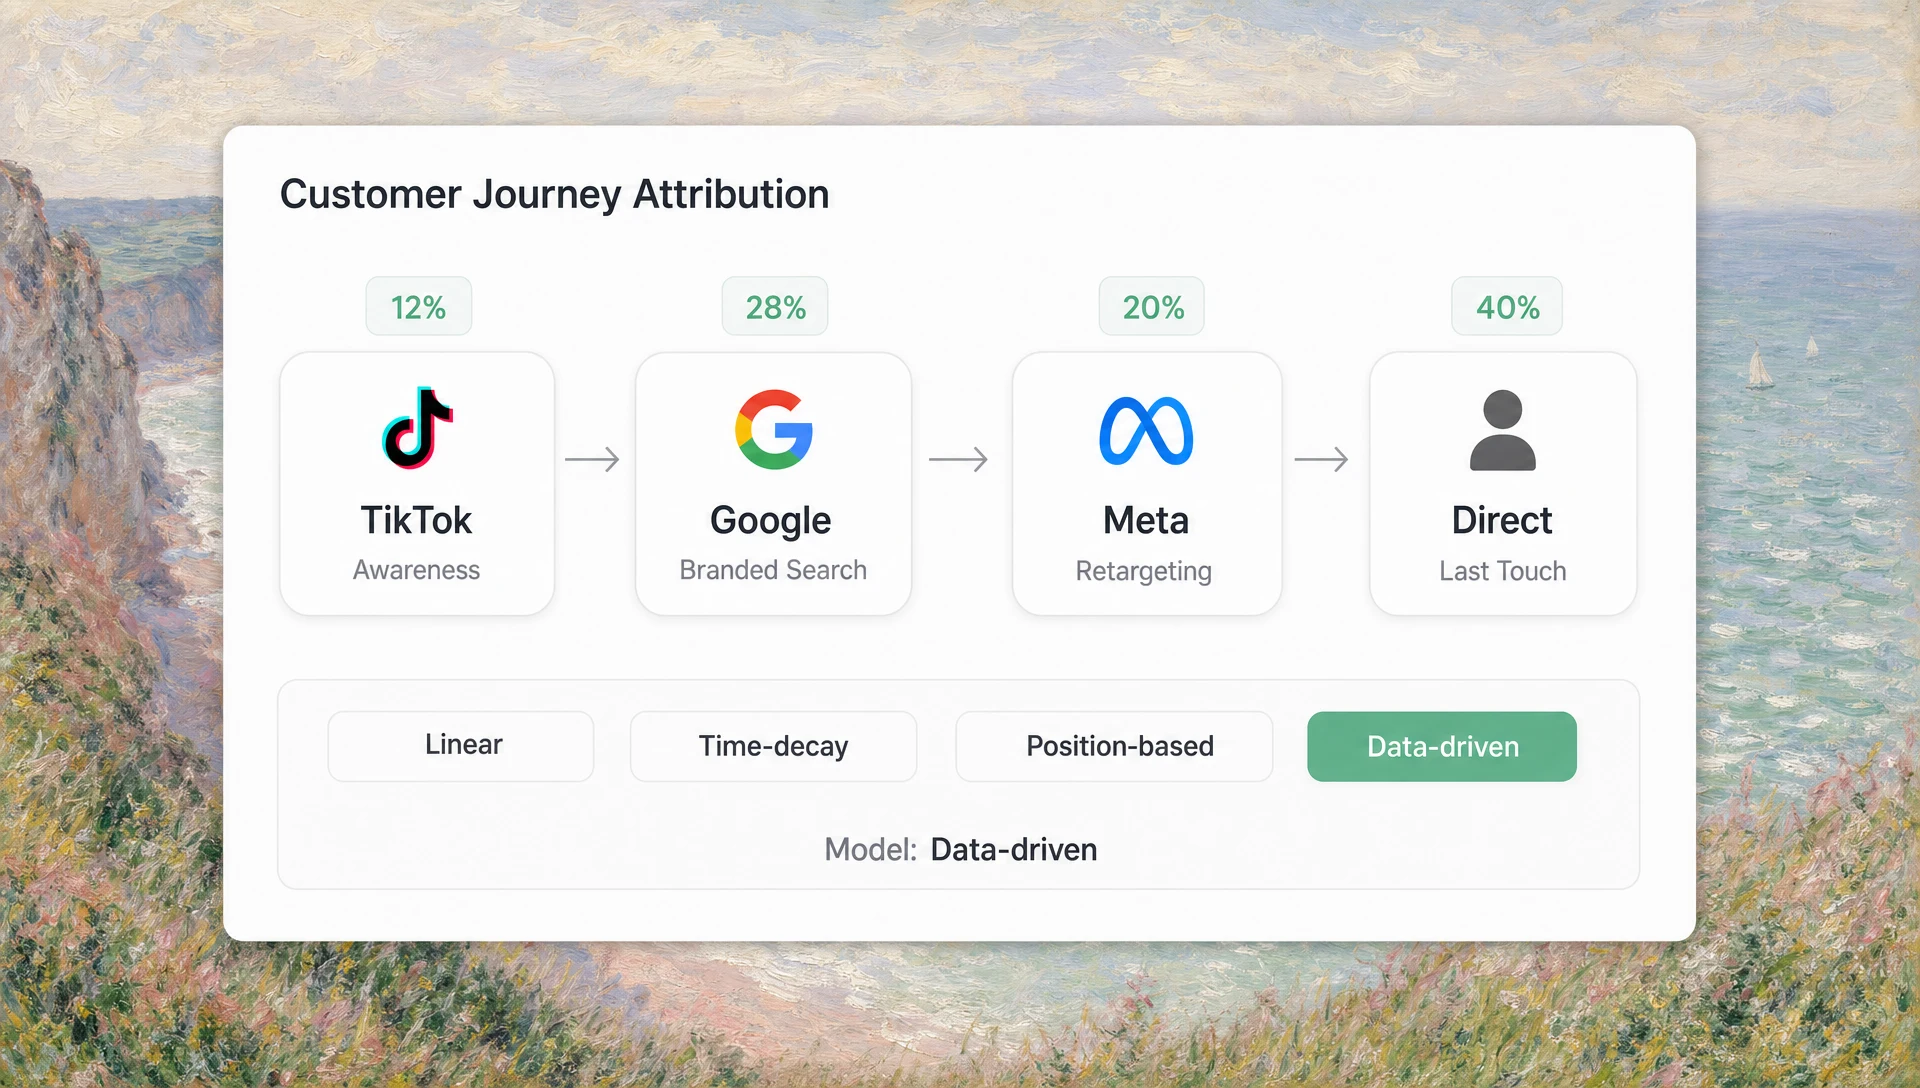
6. Data-driven attribution (including Markov chain)
How it credits: a statistical model trained on your conversion data assigns credit based on each touchpoint’s actual incremental contribution. The most common implementation is Markov-chain attribution, which computes each touchpoint’s “removal effect” — the drop in conversion probability if that touchpoint were removed from the journey.
Worked example: A Markov model on your real journey data might learn that TikTok awareness has a 15% removal effect (drop conversions by 15% without it), Google branded search has a 35% removal effect, Meta retargeting has a 25% removal effect, and direct has a 25% removal effect. Credit is allocated proportionally.
When to use it: any program with enough conversion volume (typically 1,000+ conversions/month is a reasonable floor) to support statistical modeling. Google Analytics 4’s default attribution is data-driven. Most modern DTC attribution tools (Triple Whale, Northbeam) ship some form of data-driven model.
When it fails: low-volume programs (the model overfits). Heavily walled-garden journeys where most touchpoints are invisible to the model. Major changes in channel mix (the model is trained on history and lags reality).
How to read a worked attribution comparison
Imagine a customer journey: TikTok awareness ad ($5 CPM) → Google branded search click ($1.20 CPC) → Meta retargeting click ($3.40 CPC) → direct visit → conversion at $80 order value.
Here’s how each model credits the $80:
| Model | TikTok | Meta | Direct | |
|---|---|---|---|---|
| First-touch | $80 | $0 | $0 | $0 |
| Last-touch | $0 | $0 | $0 | $80 |
| Linear (4 touches) | $20 | $20 | $20 | $20 |
| Time-decay | $8 | $16 | $24 | $32 |
| Position-based U-shape | $32 | $8 | $8 | $32 |
| Data-driven (illustrative) | $12 | $28 | $20 | $20 |
Five reasonable models, five different revenue allocations, every one defensible. The data-driven row is what your stack should converge to over time, but the others all have diagnostic value.
The modern attribution stack (what operators actually run in 2026)
No single model answers everything. The modern stack is four layers:
Layer 1: Marketing Mix Modeling (MMM) for top-down budget allocation
MMM is a statistical model that uses historical spend, sales, seasonality, and external factors (price changes, promos, macro events) to estimate each channel’s incremental contribution. It works at the channel level, not the touchpoint level, and it’s the right answer for the question “should we put another million dollars into Meta or into TikTok?”
Tools: in-house Python (Robyn, LightweightMMM), Recast, Cassandra, or DIY in spreadsheets for smaller brands.
Why it matters now: MMM doesn’t need cookies. It works on aggregated spend and revenue data. The iOS 14.5 collapse made MMM relevant again for brands that had outsourced their measurement to platform attribution.
Layer 2: Incrementality testing for validation
Incrementality testing isolates the actual lift a channel produces by holding out audiences or geos. A geo holdout pauses Meta in 5 markets for 4 weeks, compares total revenue in those markets to the rest, and computes the lift Meta actually drove.
This is the only honest way to validate platform-reported ROAS. The first time most brands run a geo holdout, the result is uncomfortable: platform-reported ROAS is typically 20-50% higher than incremental ROAS.
Run incrementality quarterly at minimum for any channel taking >15% of total spend.
Layer 3: Multi-Touch Attribution (MTA) for tactical optimization
MTA is the layer where the six models above live. It runs daily, informs which creatives and audiences to scale, and connects to your campaign management tools.
For DTC, Triple Whale and Northbeam are the operator-grade choices. Both run data-driven attribution on Shopify revenue data. Triple Whale leans into the operator-dashboard experience; Northbeam leans into the statistical rigor.
For pure web measurement without a commerce backbone, Google Analytics 4 ships data-driven attribution for free as the default. It’s better than most operators give it credit for, especially after the 2024-2025 improvements.
Layer 4: Mobile Measurement Partners (MMPs) for mobile apps
If you have a mobile app, the attribution stack changes. MMPs use SKAdNetwork on iOS and deterministic install attribution on Android, plus post-install event tracking, to connect ad spend to in-app behavior.
The three serious players: AppsFlyer, Adjust, and Singular. AppsFlyer dominates by market share; Adjust has a strong product-led position; Singular wins on data-warehouse integration. Operator pricing typically starts at $0.05-$0.07 per attributed install depending on volume.
The mobile attribution playbook is meaningfully different from web — we cover the mobile-specific KPI side in our 2026 CPI benchmarks for mobile apps, and email for mobile app marketers covers the retention measurement layer.
How to choose the right model for your context
A decision shortcut:
- You’re running a DTC brand with under 1,000 conversions/month → time-decay or position-based as your default, last-touch as a sanity floor. Skip data-driven until you have volume.
- You’re running a DTC brand with 1,000+ conversions/month → data-driven via Triple Whale or Northbeam. Cross-check with monthly MMM.
- You’re running paid search for a high-intent commerce category → last-touch is closer to truth here than people give it credit for. Customers actively searching are mostly already in-market.
- You’re running a B2B SaaS program with long sales cycles → position-based at the journey level (introduction touch + opportunity touch + closed-won touch). MMM at the program level.
- You’re running a mobile app → MMP-based attribution (AppsFlyer, Adjust). Connect to your incrementality testing tool.
- You’re running a brand-led media program (TV, OOH, podcast) → MMM is the right answer. Multi-touch attribution can’t see what it can’t tag.
The attribution mistakes operators keep making
A short list. We watch each of these collapse decisions across brands every quarter.
- Trusting platform-reported numbers as truth. Meta, TikTok, and Google all report their own attribution. Every platform under-reports the channels it doesn’t own and over-reports itself. Use platform numbers for in-platform optimization, never for cross-channel allocation.
- Adding platform-reported revenue across platforms. If you add up Meta-attributed revenue, Google-attributed revenue, and TikTok-attributed revenue, you usually get more total revenue than your actual sales. They’re double-counting the same conversions.
- Switching attribution models mid-quarter. A model change can swing reported channel performance 30-50%. Doing it mid-quarter makes month-over-month trends meaningless. Switch models at quarter boundaries with explicit before/after reporting.
- Treating MTA as truth instead of approximation. Even data-driven MTA is a model trained on partial data. Use it for tactical decisions, validate with incrementality, calibrate with MMM. Don’t treat the Triple Whale dashboard as the answer; treat it as the question that incrementality tests answer.
- Ignoring view-through entirely or counting it fully. View-through (counting a conversion if the customer saw your ad but didn’t click) is sometimes real and often noise. Run it with a 1-day window if you must, or exclude it entirely from optimization decisions and only use it for awareness reporting.
For more on the ROAS side of this question (how attribution lies translate into ROAS lies), see our ROAS playbook.
Cross-channel attribution vendors worth knowing
The names that come up most in 2026 operator conversations:
- Triple Whale — DTC default. Shopify-native. Strongest product on operator UX.
- Northbeam — DTC, stronger on the statistical side. Better fit for brands with in-house analytics teams.
- Rockerbox — broader (B2B + DTC). MMM + MTA integrated.
- Mixpanel / Amplitude — product analytics with attribution layers. Best for digital products and SaaS.
- HubSpot Marketing Hub — B2B-oriented attribution within the HubSpot stack.
- AppsFlyer / Adjust / Singular — mobile MMPs.
What we’d do
If you’re inheriting an attribution mess:
- Audit what you’re currently using. Most teams quote platform numbers without realizing it. Write down which model produces each number in your weekly report.
- Add a blended ROAS view (total revenue / total marketing spend) to the weekly. Anchor decisions on this, not on summed platform ROAS.
- Install Triple Whale or Northbeam if you’re a DTC brand on Shopify. Or commit to a build-it-yourself approach with GA4 + warehouse + a willing analyst.
- Run a geo holdout on your biggest spend channel within 90 days. Use the result to calibrate the model.
- Run MMM quarterly at minimum. For brands over $10M annual ad spend, monthly.
- Revisit the model annually, not at random. Attribution models accumulate technical debt and trust debt the same way code does.
Attribution is a discipline of useful approximations. The goal isn’t truth; it’s “good enough to make better budget decisions than the next operator.”
FAQ
What is the linear attribution model?
Linear attribution distributes equal credit to every touchpoint in a customer’s journey. A four-touch journey gives 25% credit to each touch. It’s a simple baseline that beats single-touch models but assumes every touchpoint matters equally, which is rarely true. Useful as a sanity check, not as a primary decision model.
What is position-based attribution?
Position-based attribution (U-shaped) gives 40% credit to the first touchpoint, 40% to the last, and splits the remaining 20% across the middle touches. W-shaped attribution adds a third spike at a “lead created” milestone. It’s a heuristic that acknowledges both introduction and closing touches matter — most useful in longer consideration journeys.
What is Markov-chain attribution?
Markov-chain attribution is a data-driven model that computes each touchpoint’s “removal effect” — the drop in conversion probability if that touchpoint were removed from the journey. It distributes credit proportionally to those removal effects. Most modern data-driven attribution tools use Markov chains or a close variant under the hood.
Which attribution model is most accurate?
None of them are accurate in an absolute sense. Data-driven models (Markov, Shapley) tend to be the most useful for tactical optimization in DTC programs with enough conversion volume. For top-down budget allocation, marketing mix modeling beats every multi-touch attribution model. The honest answer: stack MMM + incrementality + MTA, and don’t trust any single model alone.
What’s the difference between MMM and MTA?
Marketing mix modeling (MMM) is a top-down statistical model that estimates channel-level contribution from aggregated spend and revenue data — no cookies needed, works for offline channels. Multi-touch attribution (MTA) is bottom-up, attributing individual conversions to specific touchpoints — requires user-level tracking, breaks under iOS privacy restrictions. Modern stacks use both: MMM for budget allocation, MTA for tactical optimization.
Related reading
- The ROAS playbook — the metric attribution feeds into.
- 2026 CPI benchmarks for mobile apps — the mobile-specific KPI layer.
- SEO vs AEO in 2026 — the upper-funnel measurement equivalent.
- How to launch AI ads on Meta — the platform that produces the most attribution headaches.
- How to launch AI ads on TikTok — the platform where attribution most often disagrees with platform-reported numbers.
- Email for mobile app marketers — the retention measurement equivalent.
Letters from readers
-
Q·01 How is ad-stack funded?
We pay for every tool seat ourselves at the public plan tier, and the journal is reader-supported via the newsletter. No vendor pays for placement, and no review is sponsored.
-
Q·02 Why benchmark on the same brief instead of letting each tool play to its strengths?
Because the only fair variable in a head-to-head test is the tool. Letting each vendor pick their best demo brief is how the AI ad category got into its current marketing-led mess — every tool wins on its own showcase. Same brief means you can actually compare cost-to-published across the field.
-
Q·03 How often do you re-test tools that have shipped major updates?
Every quarter. Reviews carry a 'last tested' date in the byline. If a tool ships a meaningful capability change between quarterly cycles, we publish a field note rather than waiting — but the score on the main review only moves at the next full re-test.
-
Q·04 Can I send in a tool to be reviewed?
Yes — send a note via the contact link in the footer. We can't promise coverage of every submission, and being suggested has no bearing on the eventual verdict. Vendors who pay for seats themselves rather than offering us free credits are evaluated identically.