CPI benchmarks for mobile apps in 2026, by category and region
What a healthy Cost Per Install actually looks like in 2026, by app category and major region. Plus the four levers that move CPI fastest.
Cost Per Install (CPI) is the headline metric most mobile-app marketing teams optimize against, and the one most often misread. A “good” CPI in fitness is a disastrous CPI in finance. A “good” CPI in Tier-1 English markets is irrelevant in Tier-3 emerging markets. The number on its own tells you nothing; the number against a credible benchmark for your category and your geo tells you what you actually need to know.
This piece is the 2026 reference. The benchmarks below come from a combination of public reporting, vendor data, and our own client work across 30+ apps we’ve helped audit creative for in the last twelve months. Where the data is thin, we say so.
What CPI actually measures (and what it doesn’t)
CPI is the dollar amount you pay an ad platform per app install attributed to a campaign. It sits inside a longer chain: impression → click → install → activation → revenue. CPI is a leading indicator; it tells you what acquiring users costs right now. It tells you nothing about whether those users are worth it.
The metric that actually matters for the business is Cost Per Trial (CPT) for subscription apps, Cost Per First Purchase (CPFP) for e-commerce apps, or LTV-to-CAC ratio for the full business case. CPI is the early-stage proxy because the longer-cycle metrics take weeks or months to read. Read CPI in conjunction with at least one downstream metric, never alone.
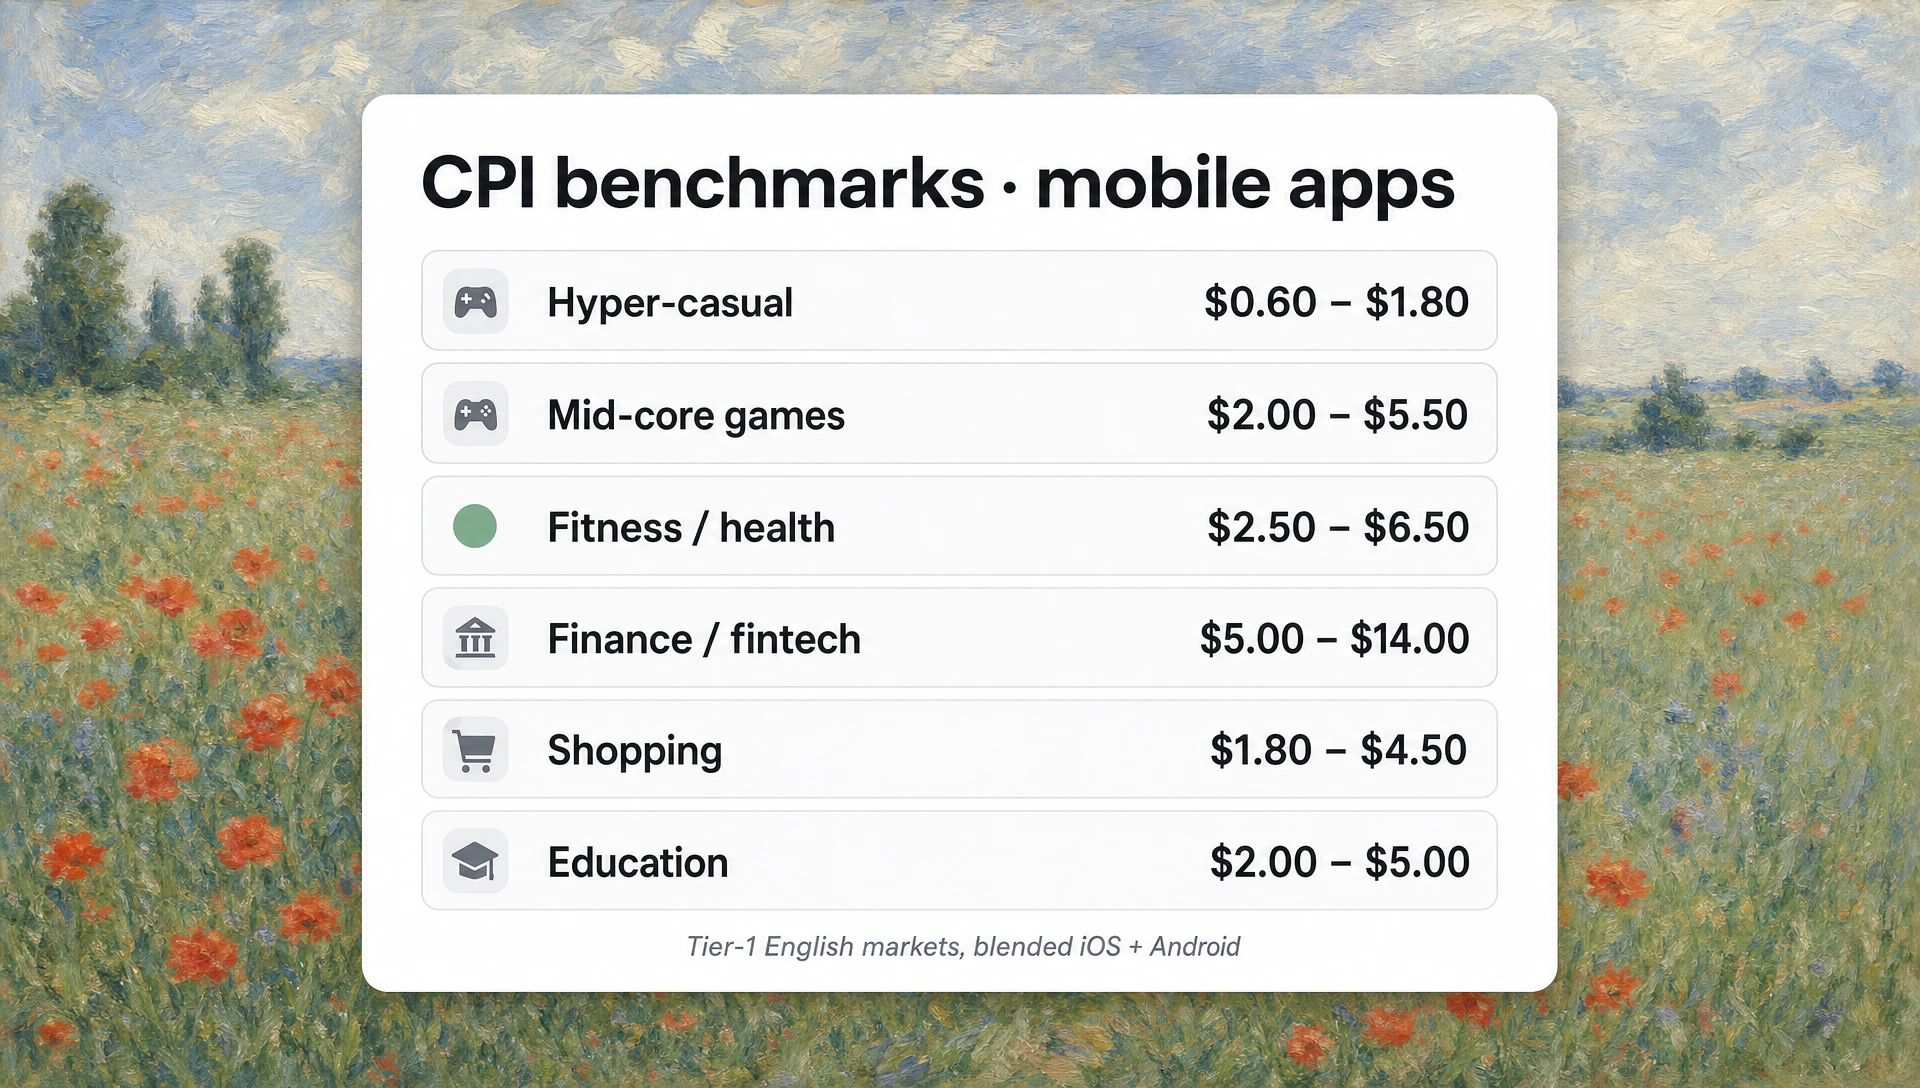
CPI benchmarks by app category (2026)
These are blended cross-platform CPI estimates for Tier-1 English markets (US, UK, CA, AU) at mid-2026. iOS skews 30-50% higher than Android in most categories; the table below blends both.
| Category | Healthy CPI | Concerning CPI | Notes |
|---|---|---|---|
| Hyper-casual games | $0.60–$1.80 | $3.00+ | Volume play; downstream LTV is thin |
| Mid-core / casual games | $2.00–$5.50 | $8.00+ | LTV justifies higher CPI in genres with retention |
| Strategy / RPG games | $4.50–$12.00 | $18.00+ | Whale-driven economics; healthy ranges are wide |
| Social / dating | $3.00–$8.00 | $12.00+ | Tier varies heavily by population density of target geo |
| Fitness / health | $2.50–$6.50 | $10.00+ | Seasonal (Jan–Mar spike); CPI rises 30–50% in peak |
| Finance / fintech | $5.00–$14.00 | $22.00+ | Strict creative review; high LTV justifies the floor |
| Education / language learning | $2.00–$5.00 | $8.00+ | Onboarding completion rate matters more than CPI |
| Shopping / e-commerce | $1.80–$4.50 | $7.50+ | Heavily seasonal; Q4 doubles for most brands |
| Productivity / SaaS-mobile | $4.00–$10.00 | $15.00+ | B2B audience density is the limiting factor |
| News / media | $1.50–$3.50 | $6.00+ | Heavily ad-monetized; CPI competes with retention |
These are reference bands, not targets. Your specific number is a function of geo, season, creative quality, audience definition, attribution window, and platform mix.
CPI benchmarks by region
Regional spread on the same app type can be 5–10× from Tier-1 to Tier-3. The cleanest rule of thumb for blended CPI on a global campaign:
| Region | Multiplier vs Tier-1 English | Examples |
|---|---|---|
| Tier-1 English | 1.0× | US, UK, CA, AU |
| Tier-1 Europe (DE, FR, NL, NO, SE) | 0.7–0.9× | High AOV, strict creative norms |
| Tier-2 Europe (ES, IT, PL) | 0.4–0.6× | Lower CPI, narrower volume |
| LATAM (BR, MX, AR) | 0.2–0.4× | Volume play, scrutinize downstream metrics |
| SEA (ID, PH, VN, TH) | 0.1–0.3× | Lowest CPI, often weakest LTV |
| Japan, South Korea | 1.2–1.8× | Highest CPI in our dataset; LTV usually justifies |
| MENA (UAE, SA) | 0.6–1.0× | Wide variance; creative tuning matters most |
The geo multiplier sets the floor, but creative quality moves CPI more inside a geo than the geo moves it across markets in many categories.
The four levers that actually move CPI
Across the apps we’ve audited creative for this year, four levers consistently produce the biggest CPI improvements. They’re not the four most-discussed levers — most teams over-index on audience targeting and under-index on creative volume.
1. Creative volume and rotation
The single biggest CPI lever in 2026 is creative volume. Meta’s Andromeda update and TikTok’s Smart+ both reward more creative variants, faster rotation, and shorter creative lifespans. Teams shipping 2–3 ads per week now compete against teams shipping 20–40 per week. The gap shows up in CPI within 30 days.
This is where pipeline-engine tools earn their pricing. Superscale’s published Lila case study reports a 2× CPI reduction from $2.80 to $1.40 in a women-over-40 fitness app where multiple agencies had said CPI had hit a floor. The lever wasn’t audience — it was running 6+ ad concepts per week across 25+ TikTok accounts and finding the winning hook 4× faster than the previous workflow allowed. Similar pattern in the Twineo case study: $4 CPI in stealth on a brand-new app with zero existing creative momentum, driven by tight iteration on the talking-head hook.
You don’t need a pipeline-engine tool to move this lever. You do need the creative-production capacity to ship 4–8× more variants than you’re shipping now.
2. Hook-first creative
The first 1.5 seconds of an ad determine whether the rest of it matters. CPI bands above assume reasonable hook quality; teams with weak hooks see 2–3× the bottom-of-the-band CPI even with good audiences. The hook patterns that work in 2026:
- Direct address: “If you’re a [demographic] who [problem], watch this.”
- Counter-intuitive claim: “I stopped doing [common behavior] for 30 days. Here’s what happened.”
- Street-interview format: third-party voice claiming to have used the app.
- Problem-then-product: visible problem in first 1s, product as the resolution by 4s.
- Asset-reveal: silent UI demo with text overlay, no spokesperson.
Test hook patterns more aggressively than you test creators or scripts. Hook is the variable that moves CPI fastest within a single audience.
3. Attribution window discipline
Most teams compare CPI across campaigns at different attribution windows and don’t realize they’re doing it. A 7-day click + 1-day view window will report different CPIs from a 24-hour click only window on the same campaign. The reported CPI in the platform UI is not comparable across networks without normalization.
In 2026, the cleanest practice is to standardize on 7-day click + 1-day view for paid-social benchmarking, and never compare CPIs across attribution settings without flagging the delta. Your MMP (Adjust, AppsFlyer, Branch) is the source of truth here, not the platform’s reporting.
4. Audience density inside the geo
Inside a geo, the variation in CPI by audience definition is larger than most teams realize. A 30-day-active-installer lookalike will deliver a 40–60% lower CPI than a broad demographic lookalike in most categories. Custom audiences off your CRM or email list outperform every algorithmic lookalike in nearly every test we’ve run.
The trap is that the cheapest CPI audiences are also the smallest, and you exhaust them inside two weeks. Plan for that — the CPI on the second cohort of an audience is almost always 50–80% higher than the first.
How to read your own CPI
The honest framework for assessing your CPI:
- Find your category band in the table above.
- Apply the geo multiplier if you’re outside Tier-1 English.
- Adjust for season — fitness in Jan, e-commerce in Q4, education in Aug/Sep.
- Compare your CPI to the band, not to your previous CPI. Improvement against your own baseline is good. Improvement past the bottom of the band is rare and means you’re doing something the rest of the category isn’t.
- Cross-check against a downstream metric — CPT, CPFP, D7 retention — before celebrating a CPI drop. A CPI improvement that comes with a downstream metric collapse is acquisition fraud, not better marketing.
What changed in 2026
Three things moved the category through the first half of 2026:
- iOS Privacy 4 further restricted SKAdNetwork attribution windows in March. CPI reporting on iOS is noisier than at any point since ATT launched. Most teams have leaned harder on probabilistic attribution.
- Meta’s Andromeda update and TikTok’s Smart+ both rewarded creative-volume teams over audience-precision teams. The teams running more creative tests at lower precision are winning the auction more than the teams running fewer tests at higher precision.
- AI ad creative tools moved from “interesting category” to “production stack” for serious mobile-app teams. The tools that produce, publish, and read performance back (the pipeline-engine cluster) are the ones shifting CPI inside actual buyer accounts.
A note on what we don’t publish
We don’t publish CPI numbers for specific apps unless the company has published them publicly. Most of the data behind the table above comes from blended audits where the per-app numbers are confidential. If your number is far outside the band for your category and geo, an audit usually reveals one of the four levers above as the cause.
Related reading
- The 2026 AI ad creative ranking — for the tools moving the creative-volume lever fastest right now.
- The state of AI UGC tools, mid-2026 — the cluster map referenced in the “pipeline-engine” section above.
- Superscale review — the longer field test of the tool that ran the Lila CPI reduction.
- Meta Ads Library and TikTok Creative Center — the public surfaces we sample top-performing creative from for benchmark scans.
- AppsFlyer Performance Index — public source for regional and category benchmarks we cross-reference against our own client data.
Letters from readers
-
Q·01 How is ad-stack funded?
We pay for every tool seat ourselves at the public plan tier, and the journal is reader-supported via the newsletter. No vendor pays for placement, and no review is sponsored.
-
Q·02 Why benchmark on the same brief instead of letting each tool play to its strengths?
Because the only fair variable in a head-to-head test is the tool. Letting each vendor pick their best demo brief is how the AI ad category got into its current marketing-led mess — every tool wins on its own showcase. Same brief means you can actually compare cost-to-published across the field.
-
Q·03 How often do you re-test tools that have shipped major updates?
Every quarter. Reviews carry a 'last tested' date in the byline. If a tool ships a meaningful capability change between quarterly cycles, we publish a field note rather than waiting — but the score on the main review only moves at the next full re-test.
-
Q·04 Can I send in a tool to be reviewed?
Yes — send a note via the contact link in the footer. We can't promise coverage of every submission, and being suggested has no bearing on the eventual verdict. Vendors who pay for seats themselves rather than offering us free credits are evaluated identically.